You know how it goes. You’re happily using Homer or Homepage for your home-lab dashboard. It’s great. It looks nice. It does its job. But then one evening you think: “Wouldn’t it be cool if the dashboard actually showed whether my services are alive without building a custom tile for homer?”
And instead of, oh I don’t know, contributing to homer or using Uptime Kuma next to it like a reasonable person, you go full not-invented-here and build your own thing from scratch.
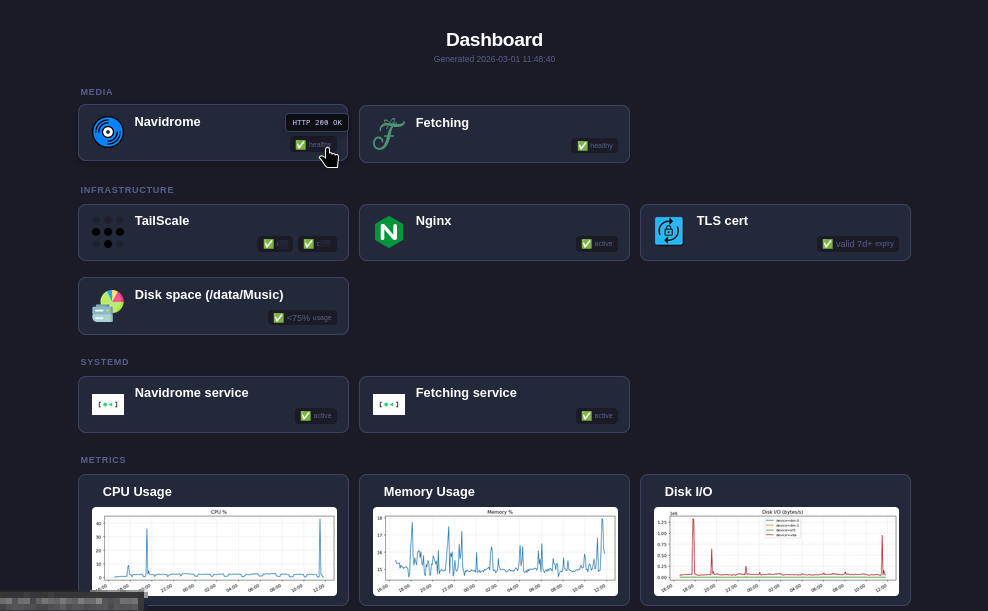
So here’s ilias, a static HTML dashboard generator that actually checks your stuff.
What makes it different from Homer / Homarr / Dashy / the other 47 dashboards?
It actually runs arbitrary checks. You give it a YAML config with HTTP endpoints and shell commands, and it:
- Executes all the checks in parallel (so treat it like a shell script and don’t be stupid!)
- Matches results against rules you define (status codes, exit codes, regex on output)
- Bakes everything into a single, self-contained HTML file. No JavaScript, no API server, no database, no Docker container running in the background
The output is literally one .html file. You can scp it to a Raspberry Pi running nginx, open it from a USB stick, email it to yourself … it just works. It’s HTML and CSS. That’s it.
The “why should I care” summary
- Zero runtime dependencies. No Node.js, no Docker, no database. One tiny binary, one HTML file out.
- Active health checks. HTTP requests, shell commands, regex matching on output. Not just a bookmark page.
- Generate blocks. Run a command before rendering: pipe a Prometheus query into a chart, embed the image as a banner: now your dashboard can show graphs.
- Single HTML file output. Icons, CSS, images, everything is inlined. The file is fully self-contained.
- NixOS module included. Systemd timer, nginx vhost, sandboxed service. If you’re a NixOS person, it’s
services.ilias.enable = trueand you’re done (after verifying my code ofc, I’m just a rando on the internet!). - ~1,100 lines of Go. One external dependency (
gopkg.in/yaml.v3). That’s the whole thing. You can read the entire codebase during lunch.
Quick taste
Minimal config:
title: My Lab
groups:
  - name: Services
    tiles:
      - name: Jellyfin
        icon: https://cdn.jsdelivr.net/npm/simple-icons@v9/icons/jellyfin.svg
        link: http://jellyfin.lan:8096/
        slots:
          - name: status
            check:
              type: http
              target: http://jellyfin.lan:8096/health
            rules:
              - match: { code: 200 }
                status: { id: ok, label: "✅" }
              - match: {}
                status: { id: down, label: "❌" }
ilias generate -c config.yaml -o index.html
Done. Open index.html. Your Jellyfin tile shows ✅ or ❌ based on whether /health returns 200.
Want to check disk space too? Add a command check:
      - name: Disk
        slots:
          - name: root
            check:
              type: command
              target: "df / --output=pcent | tail -1 | tr -d ' '"
            rules:
              - match: { output: "^[0-6]\\d%$" }
                status: { id: ok, label: "✅ <70%" }
              - match: { output: "^[7-8]\\d%$" }
                status: { id: warn, label: "⚠️ 70-89%" }
              - match: {}
                status: { id: full, label: "🔴 ≥90%" }
Hover over any status to see the raw command output in a tooltip. Regex matching on stdout. Exit codes. The works.
“But what about…”
Uptime Kuma? Uptime Kuma is excellent for monitoring with alerting, history, and notifications. ilias can’t do any of that! It’s for when you want a single glanceable status page that you regenerate every 5 minutes via cron ro whatever. No history, no alerts, no database. Just “is everything green right now.”
Homer? Homer is a beautiful bookmark dashboard. ilias took that idea and asked “what if the bookmarks could tell you if my random, unsupported service behind them is actually working?” If you just want a pretty link page or use the services already supported, Homer is great. If you want status checks for everything baked in, give ilias a try.
Links
- github.com/halfdane/ilias
- downloads (binaries for Linux amd64/arm64, macOS)
Edit:
Based on the suggestions from the comments that the config might be a tiny bit noisy, I implemented a few easy ways to simplify bigger configs (see here ). Since I’m misusing semver for pride-versioning, that bumped my version up to a whopping 0.2.0 🥳
Edit 2:
Someone said they might use this to make service health publicly available to customers, which made me worry about information leakage.
And since I couldn’t stop worrying, I added:
--no-tooltipsparam: Don’t include command output for hover tooltips to prevent system information from leaking--no-timestampparam: Omit the “Generated at” timestamp to hide system clock and monitoring cadence.
If you’re using these, I feel much better about making the html publicly accessible, but when you set up a config please remember that link-tags can expose your internal topology and the tile/slot name might do the same! Don’t go naming your tiles something like “Database Primary”, “Payment Service Worker”, or “Internal Auth API”!
wonderful! now somebody needs to rewrite this in Rust and we are done!
Go for it 👍
I’m sorry if this is a dumb question, I am on my phone and did not check much of the repo. I was thinking of adding a dashboard to my stack, and was thinking about Prometheus + grafana because of versatility but the main con is the complexity. How are the graphs generated on your example? Are they static images generated manually?
Acronyms, initialisms, abbreviations, contractions, and other phrases which expand to something larger, that I’ve seen in this thread:
Fewer Letters More Letters DNS Domain Name Service/System IP Internet Protocol PiHole Network-wide ad-blocker (DNS sinkhole) RPi Raspberry Pi brand of SBC SBC Single-Board Computer
4 acronyms in this thread; the most compressed thread commented on today has 8 acronyms.
[Thread #124 for this comm, first seen 1st Mar 2026, 20:20] [FAQ] [Full list] [Contact] [Source code]
Hey everyone! I think I got a cool idea for a dashboard!
Is it … a new tool? I love new tools 🥹
Its just an idea…
When my router says “threat” and gives me an IP address, this address gets added to a big ass database that all routers see. Then every router in the world blocks their ass out…get them to go to a government office and ID themselves as an adult if they want back in.
soo… servers your router doesn’t like for whatever reason blocked for everyone else? with gov ID checks? why would we want that?
and how is this a dashboard idea?
@altphoto @selfhosted This is essentially what Pi-Hole does. It handles your DNS queries and blocks any that you want. It automatically updates blocklists from a variety of sources available. Some IPs are trackers, advertisers, malware, phishing and other notorious or otherwise obnoxious. You decide. Works great. I have about 1.7 million IP addresses blocked, but only a couple thousand or so show up on any day. Amounts to between 5% and 8% of my total traffic. I cannot fully express my joy with the FREE software. I have a dedicated Raspberry Pi 4B on my network for this purpose, but it can run on almost any Linux variant. #RPi #homelab #DNS #PiHole
Wow, I can really see this taking off in the international dashboading-scene!
Just FYI, Homepage has ping functionality to check if your services are up.
siteMonitorYes, I’m aware of that, but I always found it weird to have a live service for something that hardly ever changes. And then I had the idea of this whole “fully self contained html”, and now I can’t imagine it another way 😆
That’s just opinions though, and if Homepage strikes your fancy go for it - it’s an awesome project.
This is a great idea! Nice work man!
Ok, you might have finally gotten me to consider a “dashboard”. I’ve been wanting a simple public facing service status page and this sounds like a nice solution.
Awesome, thanks for the consideration!
Please don’t immediately start public facing however - I literally just bashed the thing together in an afternoon, so who knows what kind of exploitable information leaks it might bring!
I’m personally using it from within a tailnet, so not public facing.
Edit:
I have since added:--no-tooltipsparam: Don’t include check output for hover tooltips--no-timestampparam: Omit the “Generated at” timestamp to hide system clock and monitoring cadence.
If you’re using these, I feel much better about making the html publicly accessible, but when you set up a config please remember that link-tags can expose your internal topology and the tile/slot name might do the same! Don’t go naming your tiles something like “Database Primary”, “Payment Service Worker”, or “Internal Auth API”!
Ah, well, then perhaps I will monitor it.
For internal use I just monitor everything with zabbix. What Ive been wanting is (as I said) a public “status screen” that my few users can hit just to verify if things are in fact down or if it’s just them.
Couldn’t stop worrying about this, so I added:
--no-tooltipsparam: Don’t include check output for hover tooltips--no-timestampparam: Omit the “Generated at” timestamp to hide system clock and monitoring cadence.
If you’re using these, I feel much better about making the html publicly accessible, but when you set up a config please remember that links-tags can expose your internal topology and the tile/slot name might do the same! Don’t go naming your tiles something like “Database Primary”, “Payment Service Worker”, or “Internal Auth API”!
(unless you wanna place a honeypot)
Well, Ilias can certainly fill this niche. With a caveat:
Currently all output from checks are accessible as tooltips (so they’re in the HTML source), but for usecases such as yours it might be helpful to have the ability to suppress that kind of information leakage.
I think I’ll implement that in the coming days …
I’ve gone to write something almost exactly like this several times and never quite finished. I like how this is set up. It seems like one thing that could be improved is parameterizing the configs a bit so that e.g. matching a 200 status gives a standard label that doesn’t need added to every job
Loved that idea so much that I went and implemented it:
- The checks now have an automatic type inferrence and shorthand
- introduced default rules that are used when nothing’s configured
- realized that yaml-anchors always worked thanks to the lib I’m using.
So now with this preamble:
# Defaults are used when nothing is defined at the slot level. They can be overridden by defining rules directly on a slot.
defaults:
  rules:
    - match:
        code: 0
      status: { id: ok, label: "✅" }
    - match: {}
      status: { id: error, label: "❌" }

# YAML anchors: reusable fragments ilias doesn't interpret directly...
# it's all just yaml
_anchors:
  pct_rules: &pct_rules           # works for disk, memory, CPU …
    - match:
        output: "^[0-6]\\d%$|^[0-9]%$"
      status: { id: ok, label: "✅ <70%" }
    - match:
        output: "^[7-8]\\d%$"
      status: { id: warn, label: "⚠️ 70–89%" }
    - match: {}
      status: { id: critical, label: "🔴 ≥90%" }
I can now have a tile like this:
      - name: Memory
        slots: # combine anchors and default rules as well as check shorthands
          - name: usage
            check: "free | awk '/^Mem:/ {printf \"%.0f%\", $3/$2 * 100}'"
            rules: *pct_rules
          - name: available
            check: "free -h | awk '/^Mem:/ {print $7 \" free\"}'"
            # uses default rules
          - name: total
            check: "free -h | awk '/^Mem:/ {print $2 \" total\"}'"
            # uses default rules
And the best? It’s fully backwards compatible ❤️
Thanks again for the suggestion!
Hu, never thought of that - that’s a pretty neat idea! Thank you 🤗
Awesome work. Stuff like this is what makes
selfhostedthe best community on lemmy!There is no such thing as “too much dashboards” friend ;)