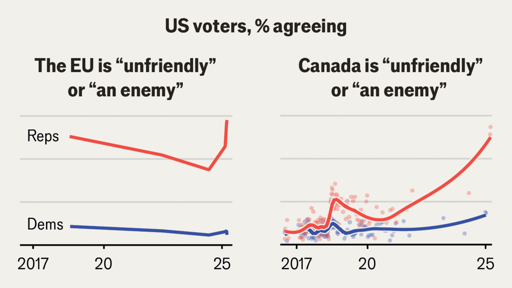
“US Voters, % Agreeing” applies to both charts. It’s a single diagram.
This is all bog standard shit. We don’t actually follow the ‘rules’ set forth in Grade 7 math class. You know that, right? Things that are obvious with just the slightest bit of reading for understanding are usually not repeated.
deleted by creator
They’re getting heated yeah, but I don’t see the issue with the graphs.
The x-axis is the year (not labelled, but reasonably inferred)
The Y-axis is percent of Americans agreeing (numbered on the right instead of the usual left, but explained in the header)